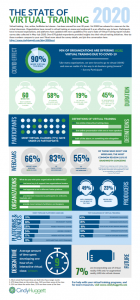
 This year’s survey was conducted between May and July. Almost 900 responses came in (870, to be exact). The results are summarized in the following infographic, which is also available for download.
While the key data points can be found in the graphic, there are several items of particular interest.
In addition to the survey data collected, I searched for and compiled key virtual training statistics from several readily available industry reports. My curated summary can be seen in this infographic, which is also available for download.